
XO INVESTMENTS’ services for private clients range from asset management to pensions advice.
The estimated performance of our sample of pension funds is strongly positive in 2024. The XO PFR returned 9.7%, which is a very good year for Swiss pension funds. The year got off to a flying start, with performance already approaching 5% after the first quarter. Despite episodes of volatility, the following quarters continued the same trend.
Donald Trump’s election in November unleashed the equity market and extended returns at the end of the year and even into 2025. This time, our estimate exceeds the UBS pension fund performance indicator, whose 2024 return is 7.7%. However, our estimate remains in line with the ZKB pension fund monitor, which reaches 9.1% in 2024.
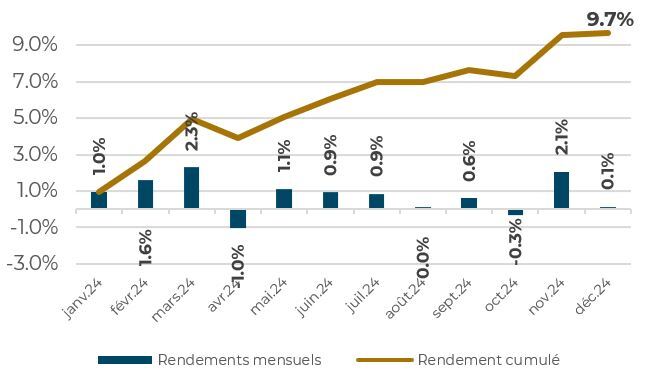
The graph above shows the monthly and cumulative performance of the XO PFR sample for the year 2024. Yields rose sharply at the start of the year and, despite slight declines in April and August, the rally continued into September. The month of October was marked by hesitation on the part of the financial markets in the wake of the US election. This uncertainty disappeared in November. The robustness of the US economy and its dominance of the technology sector largely contributed to the year’s good performance. Despite this, performance was highly concentrated in a handful of technology and artificial intelligence stocks. Investors were also hoping for rate cuts in the US, but these did not materialise in Europe due to economic weakness, particularly in Germany and the UK. This economic gloom is also the result of the difficulties in China.
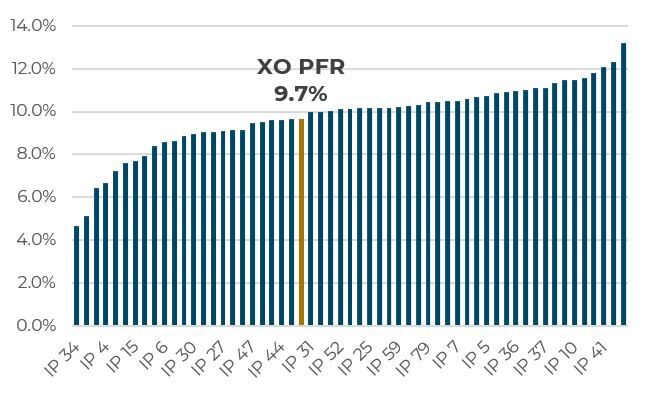
According to our sample, all the pension funds will post a positive performance in 2024. In relative terms, the best performer is 13.2%, while the pension fund with the worst performance in the sample is 4.6%. The vast majority of the sample, i.e. 90% of pension funds, posted a performance of between 7.5% and 11.6%. This relatively wide performance gap highlights the concentration of sources of return. This is due in particular to the strong performance of foreign equities.
The graph below shows how the average asset allocation of our sample has evolved over the last four years. Liquidity levels remained stable at 4.1% during the period under review and fell slightly to 3.9%. We also observe an increase in foreign-currency bonds and a decrease in CHF bonds, despite stable weights until 2024. The proportion of Swiss and foreign equities increases slightly compared with last year, returning to lower levels in 2021 and 2022. The proportion of investments in mortgages falls to around 3.0%, with a sharp decline in 2023. Real estate, which rose sharply in 2023, will remain at a high level again in 2024, making up almost ¼ of Swiss pension funds’ portfolios. Finally, alternative investments continue to grow, increasing by around one percentage point over the period under review.
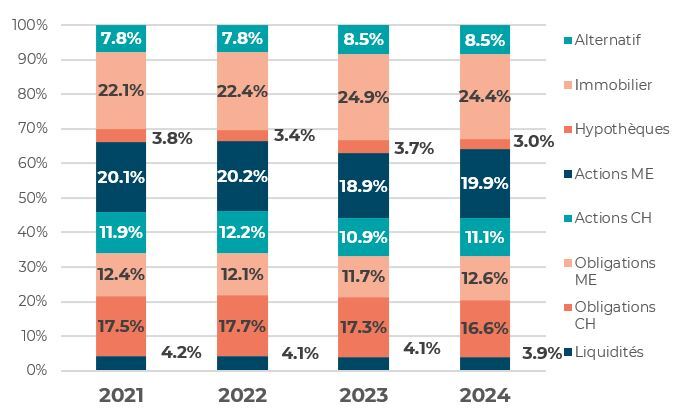
At the start of 2024, we expected an increase in the proportion of bonds in the average allocation of the pension funds in our sample. This effect is not currently visible, as the performance of bonds is generally well below that of equities, and even negative in the case of foreign bonds. It is also possible that pension funds have not seen fit to reallocate to these fixed-income assets. Alternative investments will continue to grow in the portfolios of pension funds, as many assets in this category have interesting characteristics, such as infrastructure, private equity, insurance-linked securities and senior loans.
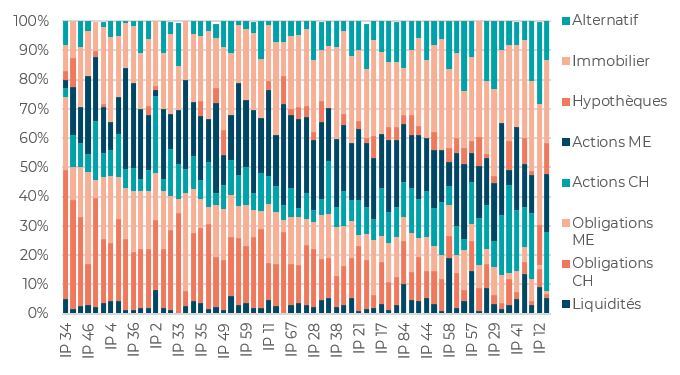
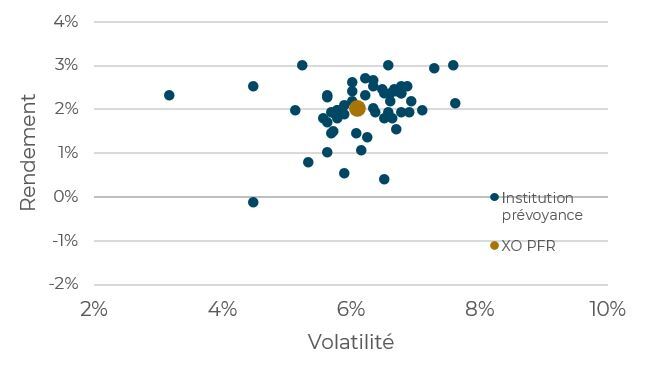
The graph below shows the asset allocation of the pension funds in the sample. The disparities are still very wide and reveal heterogeneous demographic structures and investment strategies. We have classified the pension funds according to their risk appetite, which is reflected in the quantity of bond assets. We find that the institutions on the far right with a low allocation to bonds do not have a high allocation to equities, but that this underexposure to bonds is reflected in a higher allocation to real estate and alternative investments. With the exception of a few pension funds, the amount of liquid assets remains limited to less than 5%.
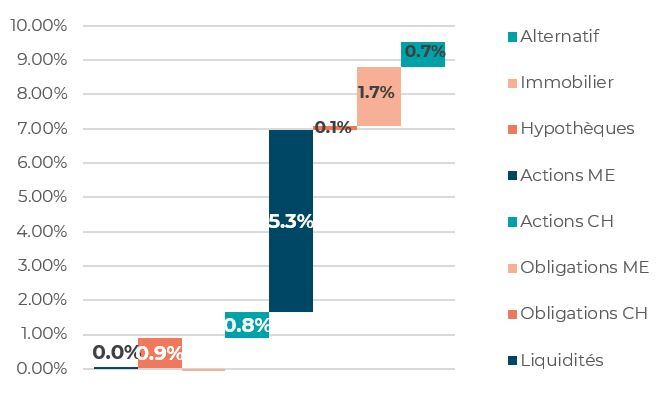
In 2024, the contributions of the main asset classes are essentially positive, with the exception of foreign bonds. Foreign equities remain the biggest contributors to performance. Swiss equities also contributed 80 basis points to performance. Swiss bonds outperformed equities by 90 basis points. Swiss real estate had an excellent year, buoyed by the successive rate cuts announced by the SNB. Real estate contributed 1.7% during the period under review. Alternative investments benefited from a good performance in commodities, private equity and precious metals. Foreign bonds made a negative contribution due to an unfavorable currency effect. The strength of the CHF explains the SNB’s decision to cut interest rates. Finally, cash and mortgages made a marginal contribution in 2024.
The strong positive performance in 2024 made a major contribution to maintaining the risk/return profile of pension funds. In terms of Sharpe ratio, the average value remained stable during the period under review, reaching 0.32 at the end of 2024.
XO Investments offers pension funds an individual comparison with all the Swiss pension funds in our sample.
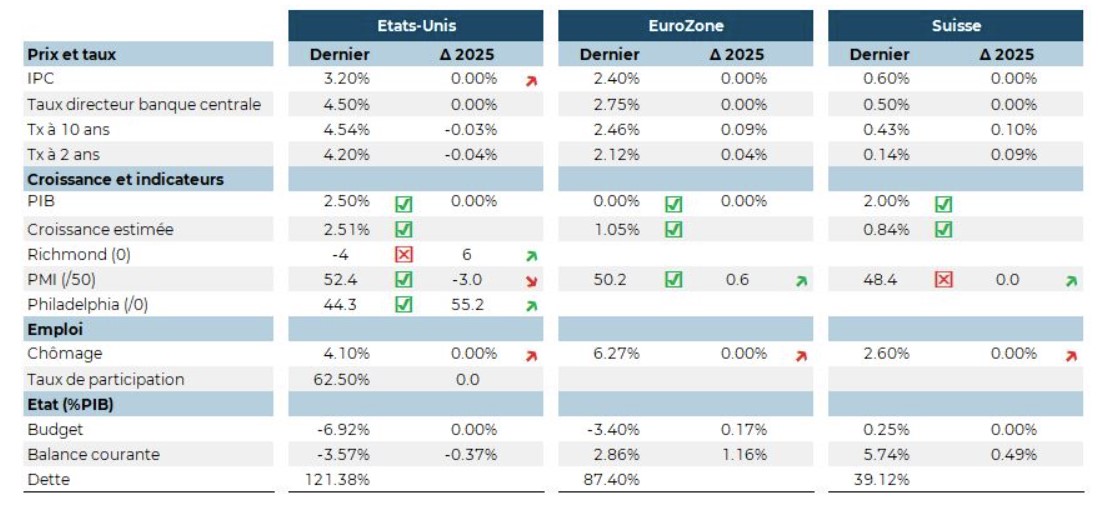
Donald Trump is giving his instructions this January: lower oil prices, lower US interest rates. Unfortunately, neither seems to be responding to his demands. With inflation picking up slightly (2.9% in December), the FED pauses the rate-cutting cycle it began in September. Powell cites domestic political uncertainty as one of the reasons for the pause. If the tariff barriers imposed on Canada, Mexico and China were to rise, excess inflation of between 0.5% and 2% could arise. From the Fed’s point of view, it is therefore urgent to wait for Donald Trump to clarify the implementation of his political agenda. And the slowdown in wage growth offers a counterbalance to the impact of tariffs.
Donald Trump is giving his instructions this January: lower oil prices, lower US interest rates. Unfortunately, neither seems to be responding to his demands. With inflation picking up slightly (2.9% in December), the FED pauses the rate-cutting cycle it began in September. Powell cites domestic political uncertainty as one of the reasons for the pause. If the tariff barriers imposed on Canada, Mexico and China were to rise, excess inflation of between 0.5% and 2% could arise. From the Fed’s point of view, it is therefore urgent to wait for Donald Trump to clarify the implementation of his political agenda. And the slowdown in wage growth offers a counterbalance to the impact of tariffs.